Rohit, H. K* , Chitranayak , Minz, P. S, Dabas, J. Kand Kumari, K
Dairy Engineering Division, ICAR-National Dairy Research Institute, Karnal, India.
Corresponding Author E-mail:rohithitesh005@gmail.com
DOI : http://dx.doi.org/10.13005/msri/190307
Article Publishing History
Article Received on : 31 Oct 2022
Article Accepted on : 08 Dec 2022
Article Published : 12 Dec 2022
Plagiarism Check: Yes
Reviewed by: Dr. Mary George
Second Review by: Dr. Subramanian Ravichandran
Final Approval by: Dr. Tejendra Kumar Gupta
Article Metrics
ABSTRACT:
Aqueous glycol solutions are widely used as coolant in secondary refrigeration systems. Freezing point is one of the crucial properties used to characterize the performance of coolant. Instrumental methods are often complex and require expensive equipment. For selection of right coolant mixture there was a need for systematic study of aqueous-glycol-salt solution over a wide range of composition. The research work in this paper presents a novel and rapid way for freezing point characterization of the ternary coolant mixture. The freezing behavior of ternary mixture was studied for different blends of ethylene glycol (EG), propylene glycol (PG), sodium chloride (NaCl) and water. Two sets of ternary mixture TM1 (EG-NaCl-water) and TM2 (PG-NaCl-water) were evaluated experimentally at various concentrations of glycol and NaCl. Effect of glycol and salt concentration on freezing point depression was analyzed. The results demonstrated that ternary mixtures required less EG/PG for cost effective formulation of secondary coolant for different cooling application in dairy and food processing industry.
KEYWORDS:
Coolant; Ethylene Glycol; Freezing Point; Propylene Glycol; Salt; Ternary Mixture
Copy the following to cite this article:
Rohit H. K, Chitranayak C, Minz P. S, Dabas J. K, Kumari K. Estimation of Freezing Point of Ternary Coolant Mixture. Mat. Sci. Res. India;19(3).
|
Copy the following to cite this URL:
Rohit H. K, Chitranayak C, Minz P. S, Dabas J. K, Kumari K. Estimation of Freezing Point of Ternary Coolant Mixture. Mat. Sci. Res. India;19(3). Available from: https://bit.ly/3UPXs6X
|
Introduction
The temperature at which the first ice crystal can form and grow is the initial freezing temperature of a mixture (Stefl and George, 2000). The freezing point of water drops when a solute is added to it. Freezing point depression is the term used to describe the difference between the freezing temperature of pure water and that of a solution (Lamas et al., 2022). One of the most crucial measurements to determine the eutectic point for various aqueous solutions depends on the freezing point. The eutectic point of the aqueous is the lowest temperature at which a liquid solidifies completely under normal atmospheric pressure, therefore antifreeze solutions have a freezing range rather than a single freezing point (Ibrahim et al., 2019). When one or more compounds functioning as solutes are mixed with one or more solvents in such amounts as to yield lower freezing point of the mixture, the resulting aqueous solution is called as a eutectic mixture (Echlin, 2013).According to several researchers, the freezing point of the solution is the primary factor that directly affects the effectiveness of the cooling process and other significant parameters can also be determined using the freezing point (Auledaet al., 2011).
Only pure water can create a solid phase. Antifreeze liquids don’t become solid at temperatures below their freezing point. Antifreeze chemicals create ice crystals in their solution and turn into slush when exposed to temperatures 10 °C degrees below their freezing point. At very low temperatures more ice crystals will form, and the antifreeze substance will turn into a stiff mush rather than a crystalline solid. As freezing proceeds the water portion decreases while the concentration of remaining antifreeze increases and the freezing point depression is increased further (Knight and DeVries, 2009).
There are different methods for determination of freezing point like cooling curve method, extrapolation method, cryoscope, and differential scanning calorimetry (DSC). The most widely employed instruments for freezing point determination are DSC, osmometer and cryoscope.The benefits of DSC include its quick and easy operation and the ability to derive useful information from thermograms. However, because these tools are expensive and very sophisticated, they cannot always be used to determine the freezing point. The DSC method’s primary drawback is that it cannot precisely pinpoint the freezing point as shown by the cooling curve method (Rahmanet al., 2009). DSC analysis requires a small sample size (10–15 ml) and therefore it is challenging to generate a representative sample for a multi-component, heterogeneous, and complicated mixture (Rahmanet al., 2002; Boonsupthip and Heldman, 2007). To produce meaningful outcomes, the tools require expertise. Therefore, it is imperative to create a quick and precise procedure for determining the freezing point.
Freezing point is one of the important properties of the secondary coolant. Therefore its appropriate determination has a vital role in the cooling application (Bainy, 2015). There are many literatures available on different aqueous-glycol-salt solution. But these are mostly isolated studies and do not provide wide range of data. For selection of right coolant mixture there was a need for systematic study of aqueous-glycol-salt solution over a wide range of composition. A novel and rapid four step methods has also been proposed to determine freezing point from the experimental data. In this study, the freezing behavior was studied for two set of ternary mixture TM1 (EG-NaCl-water) and TM2 (PG-NaCl-water) at various concentrations of glycol and NaCl.
Materials and Methods
Formulation of ternary mixture
There are basically two different types of antifreeze i.e.salt which is often soluble only to a certain amount and liquid that is soluble over the entire range of concentration with water. The freezing point of mixture will drop when antifreeze chemical is added to a water-based fluid as an additive (Stefl and George, 2000).In this study NaCl was used as salt component. For liquid antifreeze component ethylene glycol (EG) and propylene glycol (PG) were used. Analytical grade chemicals EG (Cat no. 47471, Sisco Research Laboratories Pvt. Ltd., India) and PG (Cat no. 95961, Sisco Research Laboratories Pvt. Ltd., India) were procured from authorized chemical suppliers. Different compounds viz. NaCl, EG and PG at different concentration were used along with reverse osmosis (RO) water for the formulation of ternary mixture. The objective of developing ternary component coolant was for cooling application in dairy and food processing industry.
Table 1: Properties of ethylene glycol and propylene glycol.
|
|
Ethylene glycol
|
Propylene Glycol
|
|
Chemical formula
|
C2H6O2
|
C3H8O2
|
|
Molecular Weight
|
62.07
|
76.10
|
|
Assay (GC) min
|
98%
|
99.5%
|
|
Weight per ml
|
1.112-1.114g
|
1.035-1.037g
|
|
Refractive index(20°C)
|
1.431-1.432
|
1.432-1.433
|
|
M.R.P. (2500 ml)
|
Rs. 1960
|
|
Table 2: Composition of ternary component coolant mixture.
|
Antifreeze chemicals
|
Ternary mixture
|
Levels
|
|
Ethylene glycol (EG)
|
TM1
|
(EG: RO water)
1:1, 1:2, 1:3, 1:4, 1:5, 1:6, 1:7, 1:8
|
|
Propylene glycol (PG)
|
TM2
|
(PG: RO water)
1:1, 1:2, 1:3, 1:4, 1:5, 1:6, 1:7, 1:8
|
|
Sodium chloride (NaCl)
|
|
0, 1, 2, 3, 4, 5%
|
Measurement of cooling temperature profile
The 100 ml of ternary mixture was prepared by mixing salt, liquid component antifreeze chemical, and RO water using magnetic stirrer. Prepared ternary mixture was poured into temperature monitoring module (TMM) fitted with pt 100 type temperature sensor. The sensors were interfaced to data logger (Model: CT708U, Countronics, India) using 3 wire connection. TMM was kept in a deep freezer maintained at -20 °C for 12 hours. The cooling temperature profile was recorded using the data logger. The temperature data collected in form of CSV file format was imported into MS-Excel software as raw data.
Table 3: Specifications of data logger
|
Parameters
|
Details
|
|
Display
|
0.56 “Red LED display
|
|
Channels
|
Maximum 8
|
|
Sensors
|
J/K/R/ 3 wire PT-100
|
|
Resolution
|
1°C for thermocouples and 0.1°C for PT-100
|
|
Accuracy
|
±0.1°C
|
|
Range
|
-100 to 600 °C at 4-20 mA
|
|
Scanning Rate
|
User settable from 1-99 seconds
|
|
Logging Rate
|
1 second to 99 min 59 seconds
|
|
Data Logging
|
CSV file format
|
|
Mounting Type
|
Panel Type (Front: 96mm x 96mm)
|
|
Power Supply
|
230 V AC ± 15% at 50Hz
|
Estimation of freezing point using four step method
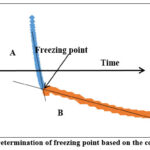
Cooling curve or temperature vs. time plot was drawn using raw temperature data in MS-Excel. The plot was used to visualize the freezing characteristics. Temperature spike was observed at the commencement of ice formation due to the liberation of heat of fusion. This spike in the curve helps to determine the initial freezing point. The initial or equilibrium freezing point is defined as the maximum temperature after ice nucleation (Rahmanet al., 2010).
For analysis, two segments were identified on the freezing curve (Fig. 1). Segment A denotesliquid being cooled to the freezing point. In segment B,phase change occurs. As freezing process proceeds there is gradual increase in solute concentration. Drop in freezing point can be seen as a gradual slope in freezing curve. If the liquid beingcooled is not a pure solvent, then the segment B will not be perfectlyhorizontal, but a tilted line.Initial freezing point was calculated at the intersection point of trend lines drawn on segments A and B (Riberoet al., 2007).
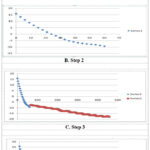
Step 1: InMS-Excel temperature versus time was plotted using raw cooling data from temperature data logger (Fig. 2a).
Step 2: Data was selected to split the graph in two segments based on the vertical and horizontal trend.Vertical segment A was plotted (Fig. 2b).
Step 3: On the same graph,horizontal segment B was plotted (Fig. 2c).
Step 4: Trend lineswere added to segments A and B. Initial freezing point was calculated at the intersection of trend lines drawn on segments A and B (Fig. 2d).
Results and discussion
The typical freezing profile of ternary mixture was indicated by the presence of dip in the cooling curve below 0 °C was due to super cooling that took place till the formation of ice crystals (Fig. 2a). The slope of freezing curve of TM solution could be due to continuous increase in the concentration of salt and glycol as pure solvent (RO water) was frozen out of the solution. It results in progressive freezing point depression. The four step method based on cooling curve was found useful for determination of freezing point. It has been reported that the cooling curve method for determining the freezing point has very high accuracy and simplicity (Marini et al., 2014; Seetapanet al., 2014). Another important phenomena known as super cooling can be monitored using time-temperature curve which occurs before the freezing point (Rahmanet al., 2002). Cooling curve approach has been used to determine the freezing point and end point of freezing for tuna meat (Rahmanet al., 2003), abalone (Sablaniet., 2004), and garlic (Rahmanet al., 2005). The cooling curve method requires manual plotting of graph between temperature verses time and sometimes it can be time consuming process in case of large number of samples. There may be risk of inaccuracy due to error in data selection. Such study often requires an expert with curve fitting skills.
Effect of glycol concentration on freezing point of ternary mixture
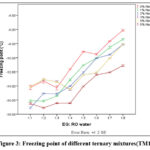
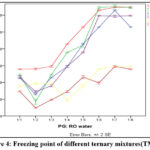
The present study demonstrated synergistic effect of glycol and NaCl on freezing point depression of the TM. Higher concentrations of EG, PG and NaCl in the TM caused significant (p< 0.05) lowering of freezing point. The results were in agreement to the findings of Prakash et al.(2018). As the EG concentration increased from 1:8 to 1:1 in ternary mixture, the freezing point declined from -6 °C to -14 °C. In case of PG, it was in the range of -5 °C to -12.5 °C which is also similar finding to the Mulawarman et al., 2018.Freezing point depression depends on the colligativelaws of the thermodynamics when added in low amount to water. For dilute ideal solutions of non electrolytes, the freezing point depression is proportional to the molar concentration of solute and not dependent on the nature of the solute. The addition of EG from 0 to 55% concentration leads to decreases in the freezing point and above 80% concentration of EG cause a rise in freezing temperature. It was also observed that the TM of ratio 1:1 and 1:2 (EG/PG: RO water) with a different concentration of NaCl was not frozen completely during the freezing at –20 °C but it was in an ice slurry form after 12 h of freezing due to the lower eutectic temperature of the mixture which is also similar to the findings of Gupta and Ramachandran (2018) and Al-Zubadi, 2007.
Effect of salt concentration on freezing point of ternary mixture
In the present study, NaCl act as a nucleating agent and it ends super cooling state and initiate freezing. When NaCl concentration was increased from 0% to 5%, the freezing point decreased at the rate of 2.5°C (Table 4 and 5) and the trend was similar to the findings of Stefl and George (2000).The freezing point depression of 5% KCl was 2.32 °C (Robert, 1994) which is lower than NaCl. Molecular weights of both the compounds are comparable (62.07 and 58.44 for EG and NaCl, respectively). In terms percentage weight basis, NaCl is almost twice as effective as EG as a freezing point depressant because NaCl dissociates into two species while EG does not. The best way to understand and compare this phenomena is by adding 20 wt% NaCl to water. It will depress the freezing point by 16.5°C, whereas a 20% (wt basis) ethylene glycol solution in water will only lower the freezing point by approximately8°C (Woods et al., 1999). At 5% NaCl concentration of TM, the rate of freezing was slow and consumed more time as compared to lower concentration of NaCl. It could be due to higher latent heat storage and freezing point depression at higher concentration of NaCl which is also similar to the finding of Li et al. (2013) and Prakash et al. (2018).
Table 4: Freezing point (°C) of different ternary mixtures (TM1)
|
EG: RO water
|
NaCl concentration
|
|
0%
|
1%
|
2%
|
3%
|
4%
|
5%
|
|
1:1
|
-14.0
|
-15.5
|
-16.0
|
-16.0
|
-16.5
|
-16.5
|
|
1:2
|
-13.5
|
-15.0
|
-15.5
|
-14.0
|
-15.5
|
-16.0
|
|
1:3
|
-13.0
|
-14.5
|
-15.0
|
-13.5
|
-15.0
|
-16.0
|
|
1:4
|
-11.7
|
-13.0
|
-14.0
|
-13.0
|
-15.0
|
-15.5
|
|
1:5
|
-9.2
|
-11.0
|
-12.0
|
-12.5
|
-13.0
|
-14.0
|
|
1:6
|
-9.5
|
-10.0
|
-10.0
|
-12.0
|
-13.0
|
-12.5
|
|
1:7
|
-7.6
|
-8.5
|
-9.5
|
-10.0
|
-12.5
|
-12.0
|
|
1:8
|
-6.0
|
-7.5
|
-8.0
|
-8.0
|
-10.0
|
-11.0
|
Table 5: Freezing point (°C) of different ternary mixtures (TM2).
|
PG:RO water
|
NaCl concentration
|
|
0%
|
1%
|
2%
|
3%
|
4%
|
5%
|
|
1:1
|
-12.5
|
-13.0
|
-13.5
|
-13.5
|
-14.5
|
-15.0
|
|
1:2
|
-12.5
|
-16.5
|
-15.5
|
-15.0
|
-14.0
|
-17.0
|
|
1:3
|
-12.0
|
-13.0
|
-13.5
|
-14.5
|
-14.0
|
-16.0
|
|
1:4
|
-9.5
|
-10.5
|
-12.0
|
-12.0
|
-16.0
|
-15.0
|
|
1:5
|
-7.5
|
-9.5
|
-9.5
|
-10.5
|
-14.5
|
-13.5
|
|
1:6
|
-5.5
|
-5.0
|
-7.5
|
-6.0
|
-12.5
|
-14.0
|
|
1:7
|
-5.0
|
-5.0
|
-5.5
|
-6.0
|
-12.0
|
-12.0
|
|
1:8
|
-5.0
|
-5.0
|
-7.5
|
-6.0
|
-12.0
|
-12.5
|
Ibrahim et al. (2019) conducted experiment on freezing point of different deep eutectic solvents of EG with methyl triphenyl phosphonium bromide (MTPB), choline chloride (ChCl), N, N-diethyl ethanolammnium chloride (DAC) and tetra-n-butyl ammonium bromide (TBAB) as salts. It was observed that freezing point of ratio 1:3 (MTPB: EG), 1:2 (ChCl: EG), 1:3(DAC: EG) and 1:2 (TBAB: EG) was -24.5, -36.26, -24.72 and -24.93 °C respectively. In the present study Freezing point depression was maximum (-16.5 °C) in case of ratio 1:1 (EG: RO water) with 5% NaCl solution. While, it was -15 °C for TM2 having ratio 1:1 (PG: RO water) with 5% NaCl(Table 4 and 5). It may be because EG has a higher thermal conductivity than PG (Dynalene, 2020; Engineering Tool Box, 2019).Freezing point depression was minimum (-5°C) in case of ratio 1:8 (PG: RO water) with 0 % NaCl ternary mixture. It was -6 °C for the ratio 1:8(EG: RO water) with 5% NaCl mixture. According to Guilpart et al. (2006), the preservation of refrigerated food at temperature between 2 to 5 °C would require a coolant temperature at around -5 °C and the freezing point of formulated TM is in the range of -5 to -16.5 °C which is extremely efficient for the subzero temperature cooling application.
Conclusion
Systematic study of aqueous-glycol-salt solution over a wide range of composition will help in selection and formulation of ternarycoolant.The freezing point of ternary mixtures (EG, NaCl and RO water; PG, NaCl and RO water) at the different concentration wassuccessfully determined using novel four step method. The results demonstrated that ternary mixtures required less EG/PG for cost effective formulation of secondary coolant for different cooling application in food industry.
Acknowledgement
The researchers are thankful to Director, ICAR-NDRI Karnal for his kind support towards the research work.
Funding source
This research received funding from ICAR-National Dairy Research Institute, Karnal under the research project E-44: Development of low cost farm milk cooling system.
References
- Al-zubadi, S.F. (2007). Phenomena of mixing ethylene glycol/water system for freezing point measurements.M.Sc.Thesis, Al-Nahrain University, Baghdad.
- Auleda, J. M., Raventós, M., Sánchez, J., & Hernández, E. (2011).Estimation of the freezing point of concentrated fruit juices for application in freeze concentration. Journal of Food Engineering, 105(2), 289-294.
CrossRef - Bainy, E. M., Corazza, M. L., &Lenzi, M. K. (2015).Measurement of freezing point of tilapia fish burger using differential scanning calorimetry (DSC) and cooling curve method. Journal of Food Engineering, 161, 82-86.
CrossRef - Boonsupthip, W., &Heldman, D. R. (2007).Prediction of frozen food properties during freezing using product composition. Journal of food science, 72(5), E254-E263.
CrossRef - Dynalene, 2020. Retrieved from https://www.dynalene.com/wp-content/uploads/2020/05/Dynalene-EG-Engineering-Guide.pdf
- Echlin, P. (2013). Low-temperature microscopy and analysis.Springer Science & Business Media.
- Engineering Tool Box, 2019. Retrieved from https://www.engineeringtoolbox.com/ethylene-glycol-d_146.html
- Guilpart, J., Stamatiou, E., Delahaye, A., &Fournaison, L. (2006). Comparison of the performance of different ice slurry types depending on the application temperature. International journal of refrigeration, 29(5), 781-788.
CrossRef - Gupta, K. K., &Ramachandran, M. (2018, June).Effect of Ethylene glycol as Phase Change Material in a Cold Storage Unit on retention of cooling. In IOP Conference Series: Materials Science and Engineering (Vol. 377, No. 1, p. 012190). IOP Publishing.
CrossRef - Ibrahim, R. K., Hayyan, M., AlSaadi, M. A., Ibrahim, S., Hayyan, A., &Hashim, M. A. (2019). Physical properties of ethylene glycol-based deep eutectic solvents. Journal of Molecular Liquids, 276, 794-800.
CrossRef - Knight, C. A., &DeVries, A. L. (2009). Ice growth in supercooled solutions of a biological “antifreeze”, AFGP 1–5: An explanation in terms of adsorption rate for the concentration dependence of the freezing point. Physical Chemistry Chemical Physics, 11(27), 5749-5761.
CrossRef - Lamas, C. P., Vega, C., &Noya, E. G. (2022).Freezing point depression of salt aqueous solutions using the Madrid-2019 model. The Journal of chemical physics, 156(13), 134503.
CrossRef - Li, G., Hwang, Y., Radermacher, R., & Chun, H. H. (2013).Review of cold storage materials for subzero applications. Energy, 51, 1-17.
CrossRef - Marini, G. A., Bainy, E. M., Lenzi, M. K., &Corazza, M. L. (2014).Freezing and thawing of processed meat in an industrial freezing tunnel. ActaScientiarum. Technology, 36(2), 361-368.
CrossRef - Mulawarman, A. A. N. B., Rasta, I. M., &Sunu, P. W. (2018, October). Characterization and Experimental Investigation of Glycerol and Propylene glycol in Water Solutions for cool Thermal Energy Storage. In 2018 International Conference on Applied Science and Technology (iCAST) (pp. 732-734).IEEE.
CrossRef - Prakash, R., Manjunatha, M., Kumar, M., &Ravindra, M. R. (2018). Freezing behaviour and cooling energy storage capabilities of aqua-salt eutectics for milk cold chain. Journal of Pharmacognosy and Phytochemistry, 7(2), 3363-3367.
- Prakash, R., Manjunatha, M., Kumar, M., &Rekha, M. (2018).Sub-zero temperature profile and chilling energy storage behaviour of aqua-glycol eutectics for milk cold chain. Journal of Pharmacognosy and Phytochemistry, 7(2), 3358-3362.
- Rahman, M. S., Al-Saidi, G., Guizani, N., & Abdullah, A. (2010).Development of state diagram of bovine gelatin by measuring thermal characteristics using differential scanning calorimetry (DSC) and cooling curve method. ThermochimicaActa, 509(1-2), 111-119.
CrossRef - Rahman, M. S., Guizani, N., Al-Khaseibi, M., Al-Hinai, S. A., Al-Maskri, S. S., & Al-Hamhami, K. (2002).Analysis of cooling curve to determine the end point of freezing. Food Hydrocolloids, 16(6), 653-659.
CrossRef - Rahman, M. S., Kasapis, S., Guizani, N., & Al-Amri, O. S. (2003). State diagram of tuna meat: freezing curve and glass transition. Journal of Food Engineering, 57(4), 321-326.
CrossRef - Rahman, M. S., Machado-Velasco, K. M., Sosa-Morales, M. E., & Velez-Ruiz, J. F. (2009). Freezing point: measurement, data, and prediction. Food Properties Handbook, 2, 153-192.
CrossRef - Rahman, M. S., Sablani, S. S., Al‐Habsi, N., Al‐Maskri, S., & Al‐Belushi, R. (2005).State diagram of freeze‐dried garlic powder by differential scanning calorimetry and cooling curve methods. Journal of Food Science, 70(2), E135-E141.
CrossRef - Ribero, G. G., Rubiolo, A. C., &Zorrilla, S. E. (2007).Initial freezing point of Mozzarella cheese. Journal of food engineering, 81(1), 157-161.
CrossRef - Robert, V. (1994), Handbook of Chemistry and Physics, CRC (55th Ed.)
- Sablani, S. S., Kasapis, S., Rahman, M. S., Al-Jabri, A., & Al-Habsi, N. (2004). Sorption isotherms and the state diagram for evaluating stability criteria of abalone. Food Research International, 37(10), 915-924.
CrossRef - Seetapan, N., Limparyoon, N., Gamonpilas, C., Methacanon, P., &Fuongfuchat, A. (2015). Effect of cryogenic freezing on textural properties and microstructure of rice flour/tapioca starch blend gel. Journal of Food Engineering, 151, 51-59.
CrossRef - Stefl, B. A., & George, K. F. (2000).Antifreezes and deicing fluids. Kirk‐Othmer Encyclopedia of Chemical Technology.
CrossRef - Woods, E. J., Zieger, M. A., Gao, D. Y., &Critser, J. K. (1999). Equations for obtaining melting points for the ternary system ethylene glycol/sodium chloride/water and their application to cryopreservation. Cryobiology, 38(4), 403-407.
CrossRef

This work is licensed under a Creative Commons Attribution 4.0 International License.