Introduction
Aluminum (Al) is the most abundantly used nonferrous alloy in engineering and structural applications due to its high strength to weight ratio. Especially in automobile and aircraft industries, Aluminum and its alloys widely used because of its reduction in weight and good mechanical properties1. less utilization of steel family materials due to the invent of metallurgy in Al and its alloys along with the manufacturing processes 2.
CNT reinforced FGCM imparts higher enhancement in properties such as electrical conductivity, better thermal stability, heat resistance, barrier resistance, thermo mechanical properties, low density compared to conventional composites 3,4. FGCM exhibits high strength to weight ratio, high stiffness to weight ratio, better fatigue resistance, wear resistance, elevated temperature properties compared to metals.
Overall properties of the materials such as physical/chemical properties (ex: melting point, hardness, wear resistance. Stability, conductivity, reactivity and optical sensitivity) can be manipulated5. CNT reinforced FGCM function better than larger structures and machines.
If the material size is less than 100nm, we call that material as nano material. One of the nano materials is carbon nanotube (CNT). Physical and chemical properties of the CNT are comparatively outstanding to steel, carbon fiber, due to which it finds application in lot of industries. Small size of carbon nanotube makes its surface area more. Increase in surface area helps in catalytic and chemical reaction. The mechanical, thermal, optical and physical properties quite outstanding compared to bulk micron materials. Enhancement in the physical, chemical and mechanical properties of composite will be done with CNT 6,7.
8 FGM composite for piston rings can be produced using aluminum silicon alloy powder and 2 weight percent MWCNT as reinforcement. These were first ball milled for six days at a speed of 40 rpm. Green compacts using cold compaction, then sinters using hot compaction at 550oC and 35MPa of pressure in a vacuum.
9 Functionally graded material with layers of variable CNT from 0-0.5wt% and Al as the base layer. The rectangular block, which was 75mm broad and 6mm thick, created a sheet with just aluminum on the bottom and a successful steady increase in CNT content from 0.1wt% to 0.5wt%. FGM is created in a rectangular block that is 6mm thick and 75mm broad. CNT patches that are black as seen by optical microscopy.
The two types of wear mechanisms in the dry sliding of Al-Si alloys are oxidative wear and metallic wear.10
Lower applied loads resulted in oxidative wear. This results in the formation of an aluminum oxide layer on both the wearing Al-Si surface and the counter face. Wear was caused by the oxidation of the asperities, followed by the fracture and compaction of the oxidized wear debris into this film.
At higher applied stresses, metallic wear mechanisms were more prevalent. Plastic deformation and fracture, considerable material transfer between the sliding surfaces, and the generation of wear debris were characteristics of the Al-Si wear surface.
Wear experiments on samples of Al-Si alloy and CNT-reinforced Al composites were performed utilizing a pin-on-disc machine and steel discs. As a result of the given load, three unique wear regimes were discovered. 11.
In case of mild wear conditions, the 1 wt.% CNTs reinforced Al6061 composite displayed lower wear rate and friction coefficient compared to the monolithic Al606112.
Materials and Methods
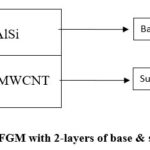
Synthesis technique for 2-layer functionally graded composite material for wear test:
2-layer functionally graded material composite with Aluminum silicon alloy is base part and Aluminum silicon alloy with MWCNT is substrate.
Where in base part composition remains same i.e., only Aluminum silicon alloy for all samples but substrate will vary with AlSi & MWCNT content 11.
Percentage of Reinforcement (MWCNT) varied with Matrix (Aluminum silicon alloy) is
99wt%AlSi+1wt% MWCNT
98.5wt%AlSi+1.5wt% MWCNT
98wt%AlSi+2wt% MWCNT
Wear test
Pin on disc equipment (Ducom, model No: ED-201, Bangalore, India) used in dry sliding wear test using ASTM standard of G99-05. The counter disc surface was made up of EN31 steel material. Pin and disc surface cleaned with acetone before testing. All the tests were performed on functionally graded composite material with two layers as shown in Figure 5.8. With varying load of 10N, 20N and 30N with sliding speed of 1m/s, 1.5m/s and 2m/s and sliding distance of 1000m, 1500m and 2000m. After each test, traces of the composite cleaned using organic solvents. The accuracy of wear loss is maintained using weighing machine of accuracy of 0.1mg. The pin specimens were tested before and after the wear test. The coefficient of friction determined using normal load and tangential load from strain gauges.
Table 1: Levels for various control factors
|
Control factors
|
Symbol
|
units
|
Level-I
|
Level-II
|
Level-III
|
|
2-Layer FGM with MWCNT variation
|
A
|
wt%
|
1wt%
|
1.5wt%
|
2wt%
|
|
Load
|
B
|
N
|
10
|
20
|
30
|
|
Sliding speed
|
C
|
m/s
|
1
|
1.5
|
2
|
|
Sliding distance
|
D
|
m
|
1000
|
1500
|
2000
|
Taguchi technique is a powerful experimental tool in analyzing large data with multiple influencing factors. It is a simple, efficient and systematic approach in determining optimal parameters. In traditional approach of conducting experiments, one to one experiment with another factor remains constant. It is a tedious process. It does not include interaction between various parameters and its effect. Effect of all parameters at a time cannot be analyzed in traditional method. Taguchi method overcomes all the shortcomings of the traditional approach.
Taguchi method helps in identifying optimizing process parameters and factors on response output 13. Observation of experiments transformed into signal-to-noise (S/N) ratio. Base on type characteristics of the problem, there are different types of signal-to-noise (S/N) ratio.
There are three categories of signal-to-noise (S/N) ratio.
Smaller-the-better
Higher-the-better
Nominal-the-best
The smaller-the-better characteristic applies to the S/N ratio for the wear loss and friction coefficient that are at their lowest.
The loss function can be transformed logarithmically to determine the S/N ratio, as shown below.
S/N = -10 log1/n (∑y2)
Where ‘n’ is the number of observations and ‘y’ is the observed data.
The four control parameters studied at three levels as shown in Table 1. The experiments were conducted as per Table 2 Using Minitab-17 software mean response graphs were plotted. ANOVA analysis helps in determining percentage contribution each parameter 12.
Results and Discussion
Table 2: Experimental technique using L27 (213) orthogonal array
|
Composition
(A)
|
Load(N)(B)
|
Sliding speed(m/sec)
(C)
|
Sliding distance(m)
(D)
|
Wear loss in gm
|
Friction force in N
|
Co-efficient of friction(µ)
|
|
1
|
1wt%
|
10
|
1
|
1000
|
0.0043
|
4.29
|
0.429
|
|
2
|
1wt%
|
10
|
1.5
|
1500
|
0.0092
|
5.21
|
0.521
|
|
3
|
1wt%
|
10
|
2
|
2000
|
0.0103
|
4.35
|
0.435
|
|
4
|
1wt%
|
20
|
1
|
1500
|
0.0072
|
8.33
|
0.4165
|
|
5
|
1wt%
|
20
|
1.5
|
2000
|
0.0062
|
10.49
|
0.5245
|
|
6
|
1wt%
|
20
|
2
|
1000
|
0.0102
|
8.94
|
0.447
|
|
7
|
1wt%
|
30
|
1
|
2000
|
0.0094
|
5.93
|
0.1977
|
|
8
|
1wt%
|
30
|
1.5
|
1000
|
0.0101
|
12.36
|
0.412
|
|
9
|
1wt%
|
30
|
2
|
1500
|
0.0095
|
13.22
|
0.441
|
|
10
|
1.5wt%
|
10
|
1
|
1500
|
0.0092
|
4.41
|
0.441
|
|
11
|
1.5wt%
|
10
|
1.5
|
2000
|
0.0037
|
5.81
|
0.581
|
|
12
|
1.5wt%
|
10
|
2
|
1000
|
0.0052
|
5.18
|
0.518
|
|
13
|
1.5wt%
|
20
|
1
|
2000
|
0.0073
|
9.33
|
0.4665
|
|
14
|
1.5wt%
|
20
|
1.5
|
1000
|
0.0102
|
19.56
|
0.978
|
|
15
|
1.5wt%
|
20
|
2
|
1500
|
0.0132
|
6.54
|
0.327
|
|
16
|
1.5wt%
|
30
|
1
|
1000
|
0.0123
|
13.5
|
0.45
|
|
17
|
1.5wt%
|
30
|
1.5
|
1500
|
0.0101
|
11.41
|
0.3803
|
|
18
|
1.5wt%
|
30
|
2
|
2000
|
0.0105
|
14.76
|
0.492
|
|
19
|
2wt%
|
10
|
1
|
2000
|
0.0103
|
4.4
|
0.44
|
|
20
|
2wt%
|
10
|
1.5
|
1000
|
0.0102
|
4.97
|
0.497
|
|
21
|
2wt%
|
10
|
2
|
1500
|
0.0031
|
5.05
|
0.505
|
|
22
|
2wt%
|
20
|
1
|
1000
|
0.0101
|
9.8
|
0.49
|
|
23
|
2wt%
|
20
|
1.5
|
1500
|
0.0121
|
12.2
|
0.61
|
|
24
|
2wt%
|
20
|
2
|
2000
|
0.0114
|
8.21
|
0.4105
|
|
25
|
2wt%
|
30
|
1
|
1000
|
0.0123
|
11.785
|
0.3928
|
|
26
|
2wt%
|
30
|
1.5
|
2000
|
0.0104
|
12.973
|
0.4324
|
|
27
|
2wt%
|
30
|
2
|
1000
|
0.0124
|
14.161
|
0.4720
|
S/N ratio’s for both wear loss and coefficient of friction computed using Minitab-17 shown in Table.3 and Table 4.
Table 3: Experimental design of L27 array with S/N ratio for wear loss
|
SL.NO.
|
Composition
(A)
|
Load(N)
(B)
|
Sliding speed (C) (m/sec)
|
Sliding distance (D) (m)
|
Wear loss in gm
|
S/N ratio (db)
|
|
1
|
1wt%
|
10
|
1
|
1000
|
0.0043
|
47.3306
|
|
2
|
1wt%
|
10
|
1.5
|
1500
|
0.0092
|
40.7242
|
|
3
|
1wt%
|
10
|
2
|
2000
|
0.0103
|
39.7433
|
|
4
|
1wt%
|
20
|
1
|
1500
|
0.0072
|
42.8534
|
|
5
|
1wt%
|
20
|
1.5
|
2000
|
0.0062
|
44.1522
|
|
6
|
1wt%
|
20
|
2
|
1000
|
0.0102
|
39.8280
|
|
7
|
1wt%
|
30
|
1
|
2000
|
0.0094
|
40.5374
|
|
8
|
1wt%
|
30
|
1.5
|
1000
|
0.0101
|
39.9136
|
|
9
|
1wt%
|
30
|
2
|
1500
|
0.0095
|
40.4455
|
|
10
|
1.5wt%
|
10
|
1
|
1500
|
0.0092
|
40.7242
|
|
11
|
1.5wt%
|
10
|
1.5
|
2000
|
0.0037
|
48.6360
|
|
12
|
1.5wt%
|
10
|
2
|
1000
|
0.0052
|
45.6799
|
|
13
|
1.5wt%
|
20
|
1
|
2000
|
0.0073
|
42.7335
|
|
14
|
1.5wt%
|
20
|
1.5
|
1000
|
0.0102
|
39.8280
|
|
15
|
1.5wt%
|
20
|
2
|
1500
|
0.0132
|
37.5885
|
|
16
|
1.5wt%
|
30
|
1
|
1000
|
0.0123
|
38.2019
|
|
17
|
1.5wt%
|
30
|
1.5
|
1500
|
0.0101
|
39.9136
|
|
18
|
1.5wt%
|
30
|
2
|
2000
|
0.0105
|
39.5762
|
|
19
|
2wt%
|
10
|
1
|
2000
|
0.0103
|
39.7433
|
|
20
|
2wt%
|
10
|
1.5
|
1000
|
0.0102
|
39.8280
|
|
21
|
2wt%
|
10
|
2
|
1500
|
0.0031
|
50.1728
|
|
22
|
2wt%
|
20
|
1
|
1000
|
0.0101
|
39.9136
|
|
23
|
2wt%
|
20
|
1.5
|
1500
|
0.0121
|
38.3443
|
|
24
|
2wt%
|
20
|
2
|
2000
|
0.0114
|
38.8619
|
|
25
|
2wt%
|
30
|
1
|
1000
|
0.0123
|
38.2019
|
|
26
|
2wt%
|
30
|
1.5
|
2000
|
0.0104
|
39.6593
|
|
27
|
2wt%
|
30
|
2
|
1000
|
0.0124
|
38.1316
|
Table 4: Experimental design of L27 array with S/N ratio for Friction coefficient
|
SL.NO
|
Composition
(A)
|
Load (B) (N)
|
Sliding speed (C)
(m/sec)
|
Sliding distance (D) (m)
|
Co-efficient of friction(µ)
|
S/N ratio (db)
|
|
1
|
1wt%
|
10
|
1.0
|
1000
|
0.429000
|
7.3509
|
|
2
|
1wt%
|
10
|
1.5
|
1500
|
0.521000
|
5.6632
|
|
3
|
1wt%
|
10
|
2.0
|
2000
|
0.435000
|
7.2302
|
|
4
|
1wt%
|
20
|
1.0
|
1500
|
0.416500
|
7.6077
|
|
5
|
1wt%
|
20
|
1.5
|
2000
|
0.524500
|
5.6051
|
|
6
|
1wt%
|
20
|
2.0
|
1000
|
0.447000
|
6.9938
|
|
7
|
1wt%
|
30
|
1.0
|
2000
|
0.197667
|
14.0813
|
|
8
|
1wt%
|
30
|
1.5
|
1000
|
0.412000
|
7.7021
|
|
9
|
1wt%
|
30
|
2.0
|
1500
|
0.440667
|
7.1178
|
|
10
|
1.5wt%
|
10
|
1.0
|
1500
|
0.441000
|
7.1112
|
|
11
|
1.5wt%
|
10
|
1.5
|
2000
|
0.581000
|
4.7165
|
|
12
|
1.5wt%
|
10
|
2.0
|
1000
|
0.518000
|
5.7134
|
|
13
|
1.5wt%
|
20
|
1.0
|
2000
|
0.466500
|
6.6230
|
|
14
|
1.5wt%
|
20
|
1.5
|
1000
|
0.978000
|
0.1932
|
|
15
|
1.5wt%
|
20
|
2.0
|
1500
|
0.327000
|
9.7090
|
|
16
|
1.5wt%
|
30
|
1.0
|
1000
|
0.450000
|
6.9357
|
|
17
|
1.5wt%
|
30
|
1.5
|
1500
|
0.380333
|
8.3967
|
|
18
|
1.5wt%
|
30
|
2.0
|
2000
|
0.492000
|
6.1607
|
|
19
|
2wt%
|
10
|
1.0
|
2000
|
0.440000
|
7.1309
|
|
20
|
2wt%
|
10
|
1.5
|
1000
|
0.497000
|
6.0729
|
|
21
|
2wt%
|
10
|
2.0
|
1500
|
0.505000
|
5.9342
|
|
22
|
2wt%
|
20
|
1.0
|
1000
|
0.490000
|
6.1961
|
|
23
|
2wt%
|
20
|
1.5
|
1500
|
0.610000
|
4.2934
|
|
24
|
2wt%
|
20
|
2.0
|
2000
|
0.410500
|
7.7337
|
|
25
|
2wt%
|
30
|
1.0
|
1000
|
0.392833
|
8.1158
|
|
26
|
2wt%
|
30
|
1.5
|
2000
|
0.432433
|
7.2816
|
|
27
|
2wt%
|
30
|
2.0
|
1000
|
0.472033
|
6.5206
|
ANOVA and the effect of factors
To get a visual representation of how several elements, such as Composition-A, Load-B, Sliding Speed-C, and Sliding Distance-D, interact. To ascertain the sequence of important elements and their interactions, an analysis of variance (ANOVA) is desirable. The level of confidence of significance 5% selected in the analysis. The results of ANOVA of functionally graded composite material in terms of wear loss and coefficient of friction in this investigation. Table.5 shows that load (p=29.89%) having maximum influence on the wear loss Composition (p=7.73%), sliding speed (p=0.5%), sliding distance (p=1.54%) having contribution towards wear loss. The interactions had less effect on the wear loss.
Similarly, Table.6 shows sliding speed (p=20.52%) having more influence on coefficient of friction compared to composition (p=8.55%), load (p=13.68%), sliding distance (p=9.57%). The interaction of Load (B)*Sliding speed (C) (p=25.85%) shows significant contribution in coefficient of friction. combinations of factors showing less influence on the coefficient of friction. Thus, load was found to be most influential parameter on the wear loss however sliding speed is the most controlling parameter in controlling coefficient of friction. The composition had a moderate effect (7.73% & 8.55%) on the wear loss and coefficient of friction.
Table 5: Analysis of Variance for wear loss
|
Source
|
Degree of freedom
|
Sum of squares
|
Adjusted sum of squares
|
Adjusted Mean of squares
|
F-ratio
|
P-value
|
Percentage of contribution
|
|
Composition(A)
|
2
|
0.000015
|
0.000015
|
0.000008
|
0.89
|
0.459
|
7.73
|
|
Load (B)
|
2
|
0.000058
|
0.000059
|
0.000029
|
3.48
|
0.099
|
29.89
|
|
Sliding speed (C)
|
2
|
0.000001
|
0.000001
|
0.000000
|
0.05
|
0.952
|
0.5
|
|
Sliding distance(D)
|
2
|
0.000003
|
0.000003
|
0.000002
|
0.19
|
0.835
|
1.54
|
|
Composition(A)*Load (B)
|
4
|
0.000016
|
0.000016
|
0.000004
|
0.48
|
0.748
|
8.24
|
|
Composition(A)*Sliding speed (C)
|
4
|
0.000026
|
0.000026
|
0.000007
|
0.77
|
0.583
|
13.40
|
|
Load (B)*Sliding speed (C)
|
4
|
0.000024
|
0.000024
|
0.000006
|
0.72
|
0.608
|
12.37
|
|
Residual Error
|
6
|
0.000051
|
0.000051
|
0.000008
|
|
|
26.28
|
|
Total
|
26
|
0.000194
|
|
|
|
|
100
|
S = 0.002908 R-Sq = 73.8% R-Sq(adj) = 0.0%
Table 6: Analysis of Variance for coefficient of friction
|
Source
|
Degree of freedom
|
Sum of squares
|
Adjusted sum of squares
|
Adjusted Mean of squares
|
F-ratio
|
P-value
|
Percentage of contribution
|
|
Composition(A)
|
2
|
0.036528
|
0.036766
|
0.018383
|
1.77
|
0.249
|
8.55
|
|
Load (B)
|
2
|
0.058435
|
0.068044
|
0.034022
|
3.27
|
0.110
|
13.68
|
|
Sliding speed (C)
|
2
|
0.087630
|
0.096465
|
0.048233
|
4.63
|
0.061
|
20.52
|
|
Sliding distance(D)
|
2
|
0.040863
|
0.036500
|
0.018250
|
1.75
|
0.251
|
9.57
|
|
Composition(A)*Load (B)
|
4
|
0.005404
|
0.005387
|
0.001347
|
0.13
|
0.966
|
1.26
|
|
Composition(A)*Sliding speed (C)
|
4
|
0.025206
|
0.025095
|
0.006274
|
0.60
|
0.675
|
5.90
|
|
Load (B)*Sliding speed (C)
|
4
|
0.110398
|
0.110398
|
0.027599
|
2.65
|
0.138
|
25.85
|
|
Residual Error
|
6
|
0.062464
|
0.062464
|
0.010411
|
|
|
14.63
|
|
Total
|
26
|
0.426927
|
|
|
|
|
100
|
S = 0.1020 R-Sq = 85.4% R-Sq(adj) = 36.6%
Influence of testing parameters on wear loss
The primary consequences of the influence of the various testing conditions on both wear loss and coefficient of friction are depicted in Fig. 2 as a graph. If a parameter’s line in the main effect plot is nearly horizontal, the parameter has no discernible effect. The most substantial impact, however, is on the line parameter with the maximum inclination. The parameter-B (load) was evidently the most important component in the main effect plot. Composition-A, sliding speed-C and sliding distance-D are influential in wear loss. Increase in the load of the functionally graded composite material leads to more loss of the material and hence more wear occurs in the material. Initially wear was less, as the load increases the wear loss gain the momentum.
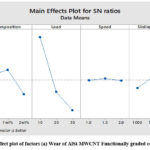 |
Figure 2: Main effect plot of factors (a) Wear of AlSi-MWCNT Functionally graded composite material
Click here to View Figure
|
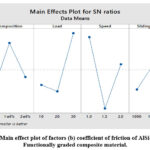 |
Figure 3: Main effect plot of factors (b) coefficient of friction of AlSi-MWCNT Functionally graded composite material.
Click here to View Figure
|
Influence of testing parameters on coefficient of friction
Fig 3. demonstrates the primary response graph for the impact of test settings on coefficient of friction. Because it has the largest inclination among the other parameters, sliding speed has the greatest impact on coefficient of friction. The parameters such as composition, load and sliding distance having less influential on coefficient of friction. Increase in the sliding speed leads to asperity-asperity contact time and more surface area contact occur leads to more friction. Larger the friction between the functionally graded material and disc leads to more coefficient of friction.
Analysing and evaluating results of the experiments using the Taguchi method
S/N ratio helps in analysing the experimental data is the essential criteria in Taguchi method. According to Taguchi method, the S/N ratio should have maximum value to obtain optimum testing condition. The S/N response tables for wear and coefficient of friction for the prepared functionally graded composite material is shown in Table 5.5 & Table 5.6. The response shows the average of the selected characteristics for each level of the factors. The response table ranks based on Delta statistics, which compare the relative magnitude of effects. The Delta statistics is the highest average for each factor minus the lowest average of the same. Ranks are assigned based on Delta values: Rank1 is assigned to highest Delta value, rank2 on second highest delta value and so on13. The optimum testing conditions were a composition of 1wt%, load of 10N, sliding speed of 1.5m/sec and sliding distance of 2000m for the best wear resistance. A composition of 1wt%, load of 30N, sliding speed of 1m/sec and sliding distance of 2000m for the best friction values.
Confirmation experiment
Taguchi strongly advises the use of the confirmation experiment to validate the results of experiments. The confirmation experiment was carried out using a mixture of the optimal levels after the optimum conditions were established to compare the outcomes with the anticipated performance14. Table 7. demonstrates the use of the ideal parameters to compare the estimated wear loss to the actual wear loss. It should be emphasised that the estimated and observed findings showed good agreement. From the initial testing conditions to the ideal testing parameters, the S/N ratio increased by 5.7218dB and 2.01248dB, respectively. This meant that the wear loss was reduced by roughly 87.17% and the coefficient of friction loss by 81.23%. This result suggests that the model developed in this study can be utilised to accurately forecast the composites’ wear behaviour and friction coefficient.
Table 7: Results of confirmation tests
|
Level
|
Initial parameter combination
A3B3C3D3
|
Optimal parameter combination
|
|
Prediction
A1B1C2D3
|
Experimentation
|
|
Wear (gm)
|
0.0115781
|
0.0059108
|
0.005723
|
|
SN ratio (dB)
|
38.8795
|
44.6013
|
46.2101
|
|
Improvement of SN ratio: 5.7218
|
|
|
A3B3C3D3
|
A1B3C1D3
|
|
|
Coefficient of friction (µ)
|
0.350600
|
0.267248
|
0.253215
|
|
SN ratio (dB)
|
8.71192
|
10.7244
|
11.3567
|
|
Improvement of SN ratio: 2.01248
|
Table 8: Response Table for Signal to Noise Ratios Smaller is better
|
Wear response
|
|
Level
|
Composition(A)
|
Load (B)
|
Sliding speed (C)
|
Sliding distance(D)
|
|
1
|
41.43
|
43.62
|
41.14
|
40.69
|
|
2
|
41.73
|
40.46
|
41.22
|
41.35
|
|
3
|
40.32
|
39.40
|
41.11
|
41.52
|
|
Delta
|
1.41
|
4.22
|
0.11
|
0.83
|
|
Rank
|
2
|
1
|
4
|
3
|
Table 9: Response Table for Signal to Noise Ratios Smaller is better
|
Coefficient of friction response
|
|
Level
|
Composition(A)
|
Load (B)
|
Sliding speed (C)
|
Sliding distance(D)
|
|
1
|
6.173
|
6.325
|
7.906
|
6.179
|
|
2
|
7.706
|
6.106
|
5.547
|
6.979
|
|
3
|
6.587
|
8.035
|
7.013
|
7.396
|
|
Delta
|
1.533
|
1.929
|
2.359
|
1.216
|
|
Rank
|
3
|
2
|
1
|
4
|
Wear mechanism of functionally graded composite material
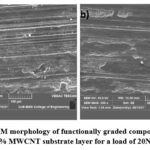 |
Figure 5(a-b): SEM morphology of functionally graded composite material with 1wt% MWCNT substrate layer for a load of 20N.
Click here to View Figure
|
Figure 5 (a-b): indicates SEM morphology of worn surfaces of functionally graded composite material with 1wt% MWCNT substrate layer for a load of 20N. Clearly exhibited the permanent grooves and fracture of oxide layer. These leads to increase more wear loss in the FGCM of 0.5wt%.
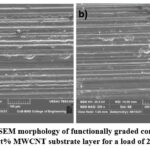 |
Figure 6(a-b): SEM morphology of functionally graded composite material with 1.5wt% MWCNT substrate layer for a load of 20N.
Click here to View Figure
|
Figure 6 (a-b): indicates SEM morphology of functionally graded composite material with 1.5wt% MWCNT substrate layer for a load of 20N. SEM images indicating finer grooves with plastic deformation at the edges of the grooves. The surfaces appear to smooth due to reinforcement of multi wall carbon nanotube. Due to proper dispersion of multi wall carbon nanotube in the Aluminum silicon matrix, there is a reduction in wear loss of the material and fine groove formation.
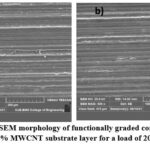 |
Figure 7(a-b): SEM morphology of functionally graded composite material with 2wt% MWCNT substrate layer for a load of 20N.
Click here to View Figure
|
Figure 7 (a-b): indicates SEM morphology of functionally graded composite material with 2wt% MWCNT substrate layer for a load of 20N. SEM images indicating finer grooves the surfaces appear to intact due to reinforcement of multi wall carbon nanotube. Due to proper dispersion of multi wall carbon nanotube in the Aluminum silicon matrix, there is a reduction in wear loss of the material and fine groove formation. Thus, it indicates the increase in the reinforcement weight percentage i.e., multi wall carbon nanotube helps in providing the better wear resistant material.
The creation of grooves, which are caused by the ploughing action of hard asperities on the counter disc, characterises the wear mechanisms 15, 16,17,18.
Conclusion
Tribological properties are determined for axial layer functionally graded composite material. L27 orthogonal Taguchi technique is followed to determine the minimum wear and less coefficient of friction with the combination of optimum factors. ANOVA technique is implemented to determine influence of each factor. The conclusions drawn are as follows:
The composites with 1wt% of FGM exhibited both excellent wear resistance and friction coefficients.
ANOVA results revealed that the most important factors influencing the sliding wear of the functionally graded composite material were the composites themselves (in terms of their individual percentage contributions) that load (p=29.89%) having maximum influence on the wear loss Composition (p=7.73%), sliding speed (p=0.5%), sliding distance (p=1.54%) having contribution towards wear loss. The interactions had less effect on the wear loss.
Sliding speed (p=20.52%) having more influence on coefficient of friction compared to composition (p=8.55%), load (p=13.68%), sliding distance (p=9.57%). The interaction of Load (B)*Sliding speed (C) (p=25.85%) shows significant contribution in coefficient of friction.
The ideal testing parameters for the best wear resistance were a composition of 1wt%, a load of 10N, a sliding speed of 1.5m/sec, and a sliding distance of 2000m. For the best friction results, use a composition of 1wt%, a weight of 30N, a sliding speed of 1m/sec, and a sliding distance of 2000m.
In a Taguchi experimental analysis, the ideal control factors for wear loss and friction coefficient were discovered to be A1B1C2D3 and A1B3C1D3 respectively.
SEM studies of the worn surfaces revealed that the wear mechanism involved with the AlSi-1wt% MWCNT composites was oxidative wear with severe plastic deformation.
The AlSi-1.5wt% MWCNT functionally graded composites had oxidative wear and delamination wear as their wear mechanisms. The main wear mechanism in the functionally graded AlSi-2wt% MWCNT composites was delamination wear.
References
- S. J. Harris, Fiber-Reinforced Aluminum Alloys,Treatise on Mater.Sci. & Tech, pp. 255–294,(1989).
CrossRef - V. K. Lindroos and M. J. Talvitie, Recent advances in metal matrix composites, J. Mater. Process. Tech., vol. 53, no. 1–2, pp. 273–284, (1995).
CrossRef - J. Aboudi, M. J. Pindera, and S. M. Arnold, Microstructural optimization of functionally graded composites subjected to a thermal gradient via the coupled higher-order theory,Compos. Part B Eng., vol. 28, no. 1–2, pp. 93–108, (1997).
CrossRef - A. Mortensen and S. Suresh, Functionally graded metals and metal-ceramic composites: Part 1 processing, Int. Mater. Rev., vol. 40, no. 6, pp. 239–265, (1995).
CrossRef - Y. M. Shabana, N. Noda, and K. Tohgo, Elasto-Plastic Thermal Stresses in Functionally Graded Materials Considering Microstructure Effects, Curr. Adv. Mech. Des. Prod. VII, pp. 223–231, (2000).
CrossRef - Azeem Pasha and B. M. Rajaprakash, Effect of CNT content on microstructure and hardness of AlSi/MWCNT nano composite, Mater. Today Proc., Volume 49, part5, Pages 1345-1350, (2022).
CrossRef - Azeem Pasha and B.M Rajaprakash, Functionally graded materials (FGM) fabrication and its potential challenges & applications, Mater. Today Proc., Volume 52, part 3, Pages 413-418, (2022).
CrossRef - O. Carvalho, M. Buciumeanu, G. Miranda, S. Madeira, and F. S. Silva, Development of a method to produce FGMs by controlling the reinforcement distribution, Mater. Des., vol. 92, pp. 233–239, (2016).
CrossRef - D. Kim, Carbon nanotubes-reinforced aluminum alloy functionally graded materials fabricated by powder extrusion process, Mater. Sci. Eng. A, vol. 745, pp. 379–389, ( 2019).
CrossRef - S. A. Kori and T. M. Chandrashekharaiah, Studies on the dry sliding wear behaviour of hypoeutectic and eutectic Al-Si alloys,Wear, vol. 263, no. 1-6 SPEC. ISS., pp. 745–755, (2007).
CrossRef - A. S. Reddy, B. N. P. Bai, K. S. S. Murthy, and S. K. Biswas, Wear and seizure of binary AlSi alloys, Wear, vol. 171, no. 1–2, pp. 115–127, (1994).
CrossRef - A. M. Al-Qutub, A. Khalil, N. Saheb, and A. S. Hakeem, Wear and friction behavior of Al6061 alloy reinforced with carbon nanotubes, Wear, vol. 297, no. 1–2, pp. 752–761, (2013).
CrossRef - S. ming Zhou, X. bin Zhang, Z. peng Ding, C. yan Min, G. liang Xu, and W. ming Zhu, Fabrication and tribological properties of carbon nanotubes reinforced Al composites prepared by pressureless infiltration technique, Compos. Part A Appl. Sci. Manuf., vol. 38, no. 2, pp. 301–306, (2007).
- N. Radhika, M. Praveen, and S. Mukherjee, Influence of process parameters on three body abrasive wear behaviour of functionally graded Aluminium alloy reinforced with alumina, J. Eng. Sci. Technol., vol. 12, no. 11, pp. 2866–2879, (2017).
- V. C. Uvaraja and N. Natarajan, Optimization of Friction and Wear Behaviour in Hybrid Metal Matrix Composites Using Taguchi Technique, J. Miner. Mater. Charact. Eng., vol. 11, no. 08, pp. 757–768, (2012).
CrossRef - P. Ravindran, K. Manisekar, P. Rathika, and P. Narayanasamy, Tribological properties of powder metallurgy – Processed aluminium self lubricating hybrid composites with SiC additions, Mater. Des., vol. 45, pp. 561–570, (2013).
CrossRef - Azeem Pasha, B.M. Rajaprakash, Effect of CNT content on microstructure and hardness of AlSi/MWCNT nano composite, Mater. Today Proc., Volume 49, part 3, Pages 1345-1350, (2022).
CrossRef - Azeem Pasha, B.M. Rajaprakash, Microstructure and Mechanical Properties of Functionally Graded AlSi/MWCNT Composite Cylinders, Material. Science., Volume 20, part 1, Pages 01-84, (2023).
CrossRef

This work is licensed under a Creative Commons Attribution 4.0 International License.

 and B.M. Rajaprakash